Uzbekistan’s foreign trade hits $24.6 billion, with gold exports surging to $5.48 billion in just four months
In January–April 2025, Uzbekistan’s foreign trade turnover reached $24.6 billion, marking a 16.3% year-on-year increase. While exports of textiles, automobiles, steel, and petroleum products declined, gold exports surged.
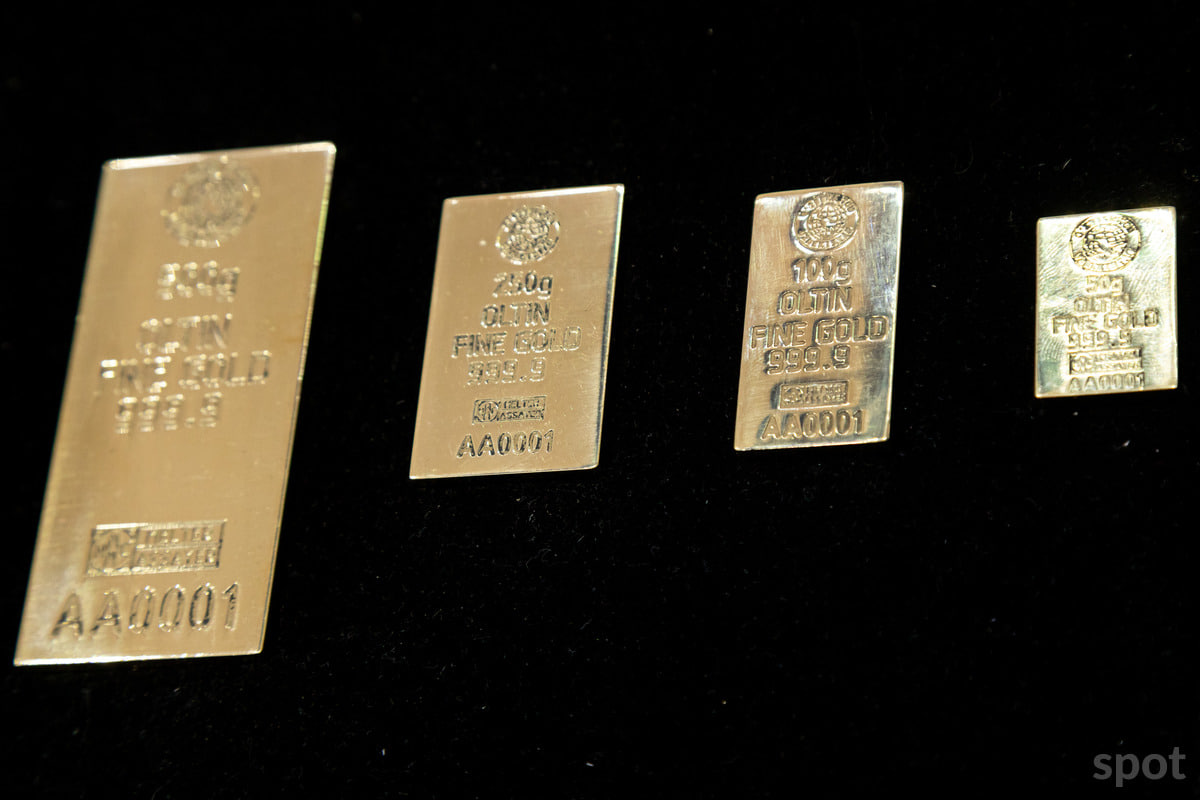
Photo: Spot
According to the report from the National Statistics Committee, Uzbekistan’s foreign trade turnover totaled $24.6 billion in the first four months of 2025. This represents a 16.3% increase compared to the same period last year, driven by a sharp rise in exports (up 35.1% to $11.88 billion) and a modest increase in imports (up 2.9% to $12.72 billion). As a result, the country’s trade deficit narrowed significantly to $846.3 million, down from $3.58 billion in 2024.
Gold exports continued to play a major role, with Uzbekistan exporting $1.91 billion worth of the precious metal in April alone. Over the four-month period, gold exports totaled $5.48 billion — a 60% increase year-on-year.
China remains Uzbekistan’s top trading partner with $4.18 billion in trade, followed by Russia with $3.7 billion. Trade with China rose by 5.6%, while trade with Russia declined by 3%.
Other major trading partners include Kazakhstan ($1.39 billion), Turkey ($834 million), and South Korea ($584.1 million). Among them, only trade with Kazakhstan increased. Rounding out the top ten were Afghanistan ($504.5 million), France ($472.8 million), Germany ($423.8 million), India ($383 million), and the UAE ($329.3 million).
Exports
Excluding gold, industrial goods remained the largest export category, though revenues dropped to $1.2 billion, a decline of 10.7%.
Textile and fabric exports generated $531.6 million, down 24.4%. Non-ferrous metals saw a slight increase to $455.3 million, while iron and steel exports halved to $35.5 million. On the other hand, exports of non-metallic mineral products rose by over 50% to $71.2 million, and metal products grew to $64.2 million.
Food exports came in second at $663.6 million, a 40.5% increase. The bulk of this came from fruits and vegetables ($429.3 million, +41.9%) and grains ($170.6 million, +33.6%).
Chemical product exports totaled $602.1 million, up 17.6%. Inorganic chemicals led with $338.9 million (+13.1%), followed by fertilizers with $126.2 million (+61.2%).
Fuel and energy exports rose 21.8% to $417.6 million. Exports of petroleum products fell 18.8% to $145.6 million, while natural gas exports nearly doubled to $199.7 million. Electricity exports increased by 29.6%, surpassing $71.7 million.
Exports of consumer and miscellaneous goods reached $409 million, up 12%. Clothing exports generated $304.4 million (+3.8%), and “various finished goods” surged 73.8% to $86.7 million.
Exports of engineering products grew 5.7% to $336.2 million. Automobiles and spare parts led the category but dropped 23.6% to $90.4 million. Electrical equipment exports rose 14.1% to $73.3 million. Exports of “other transport equipment” saw a nearly fivefold increase to $63.2 million.
Meanwhile, services exports reached $2.5 billion, accounting for 21.1% of the country's total exports — up 36.4% from Q1 2024. Leading segments were tourism ($1.18 billion), transport ($924.6 million), and IT services ($234.7 million).
Imports
Engineering products remained the top import category at $4.31 billion, down 5.1%. This included $964.4 million in vehicles (-18.6%), $884.8 million in special-purpose machinery (+3.5%), $749.1 million in general industrial equipment (+11.9%), $611.9 million in electrical equipment (+0.1%), and $314.1 million in energy generators (-2.8%).
Since the start of the year, car imports have plunged nearly threefold to $213.7 million, while imports of parts and accessories rose by 34.4% to $544.4 million.
Industrial goods ranked second with $2.06 billion in imports, up 5%. This included cast iron and steel ($949.3 million, +3.9%), metal products ($297.9 million, +9.3%), textiles ($174.4 million, +1.6%), and rubber products ($169.9 million, +21.3%).
Chemical industry imports increased by 7.7% to $1.65 billion. Medical supplies cost $610.2 million (-3.9%), primary plastics $304.6 million (+30.3%), and chemical materials $232.6 million (+4.9%).
Food imports reached $1.28 billion, up 13.7%. Grain imports amounted to $304.3 million (+3.7%), meat and meat products to $196.9 million (+66.7%), fruits and vegetables to $174.7 million (-3.2%), and sugar and confectionery to $160.2 million (-9.8%).
Imports of fuel and energy resources fell by 27.4% to $970.2 million. Oil and petroleum product imports decreased by 10.4% to $688.4 million, while gasoline imports rose 2.2% to $576.9 million. Natural gas imports from Turkmenistan and Russia dropped almost threefold to $150.5 million. Coal imports reached $66.2 million (+4.5%) and electricity $65.1 million (-9.8%).
Additionally, service imports — accounting for over 10.5% of total imports — rose by 38.6%, exceeding $1.34 billion. Tourism services led the segment at $744.7 million, followed by transport ($270.5 million) and IT services ($131.7 million).
Recommended
List of streets and intersections being repaired in Tashkent published
SOCIETY | 19:12 / 16.05.2024
Uzbekistan's flag flies high on Oceania's tallest volcano
SOCIETY | 17:54 / 15.05.2024
New tariffs to be introduced in Tashkent public transport
SOCIETY | 14:55 / 05.05.2023
Onix and Tracker cars withdrawn from sale
BUSINESS | 10:20 / 05.05.2023
Latest news
-
Toxic smoke covers Navoi city, residents report health concerns, Navoiyazot denies responsibility
SOCIETY | 19:39
-
Chinese company Baibuting launches $1.8 billion green energy project in Akhangaran
BUSINESS | 18:16
-
Baby born aboard Uzbekistan Airways flight from Istanbul to Tashkent
SOCIETY | 18:02
-
Uzbekistan set to increase fruit and vegetable exports to Mongolia tenfold, invest $100 million in joint projects
BUSINESS | 17:59
Related News

17:59
Uzbekistan set to increase fruit and vegetable exports to Mongolia tenfold, invest $100 million in joint projects

17:39 / 18.07.2025
Uzbekistan to import 100,000 small livestock from Mongolia under new agricultural agreement

12:12 / 18.07.2025
Gold smuggler detained at Fergana border post with UZS 5.2 billion in valuables
16:28 / 17.07.2025
